Palettes
The package provides color and fill scales to match the Cardea color palette. There is a palette called “Multicolor” that uses all of Cardea’s colors.
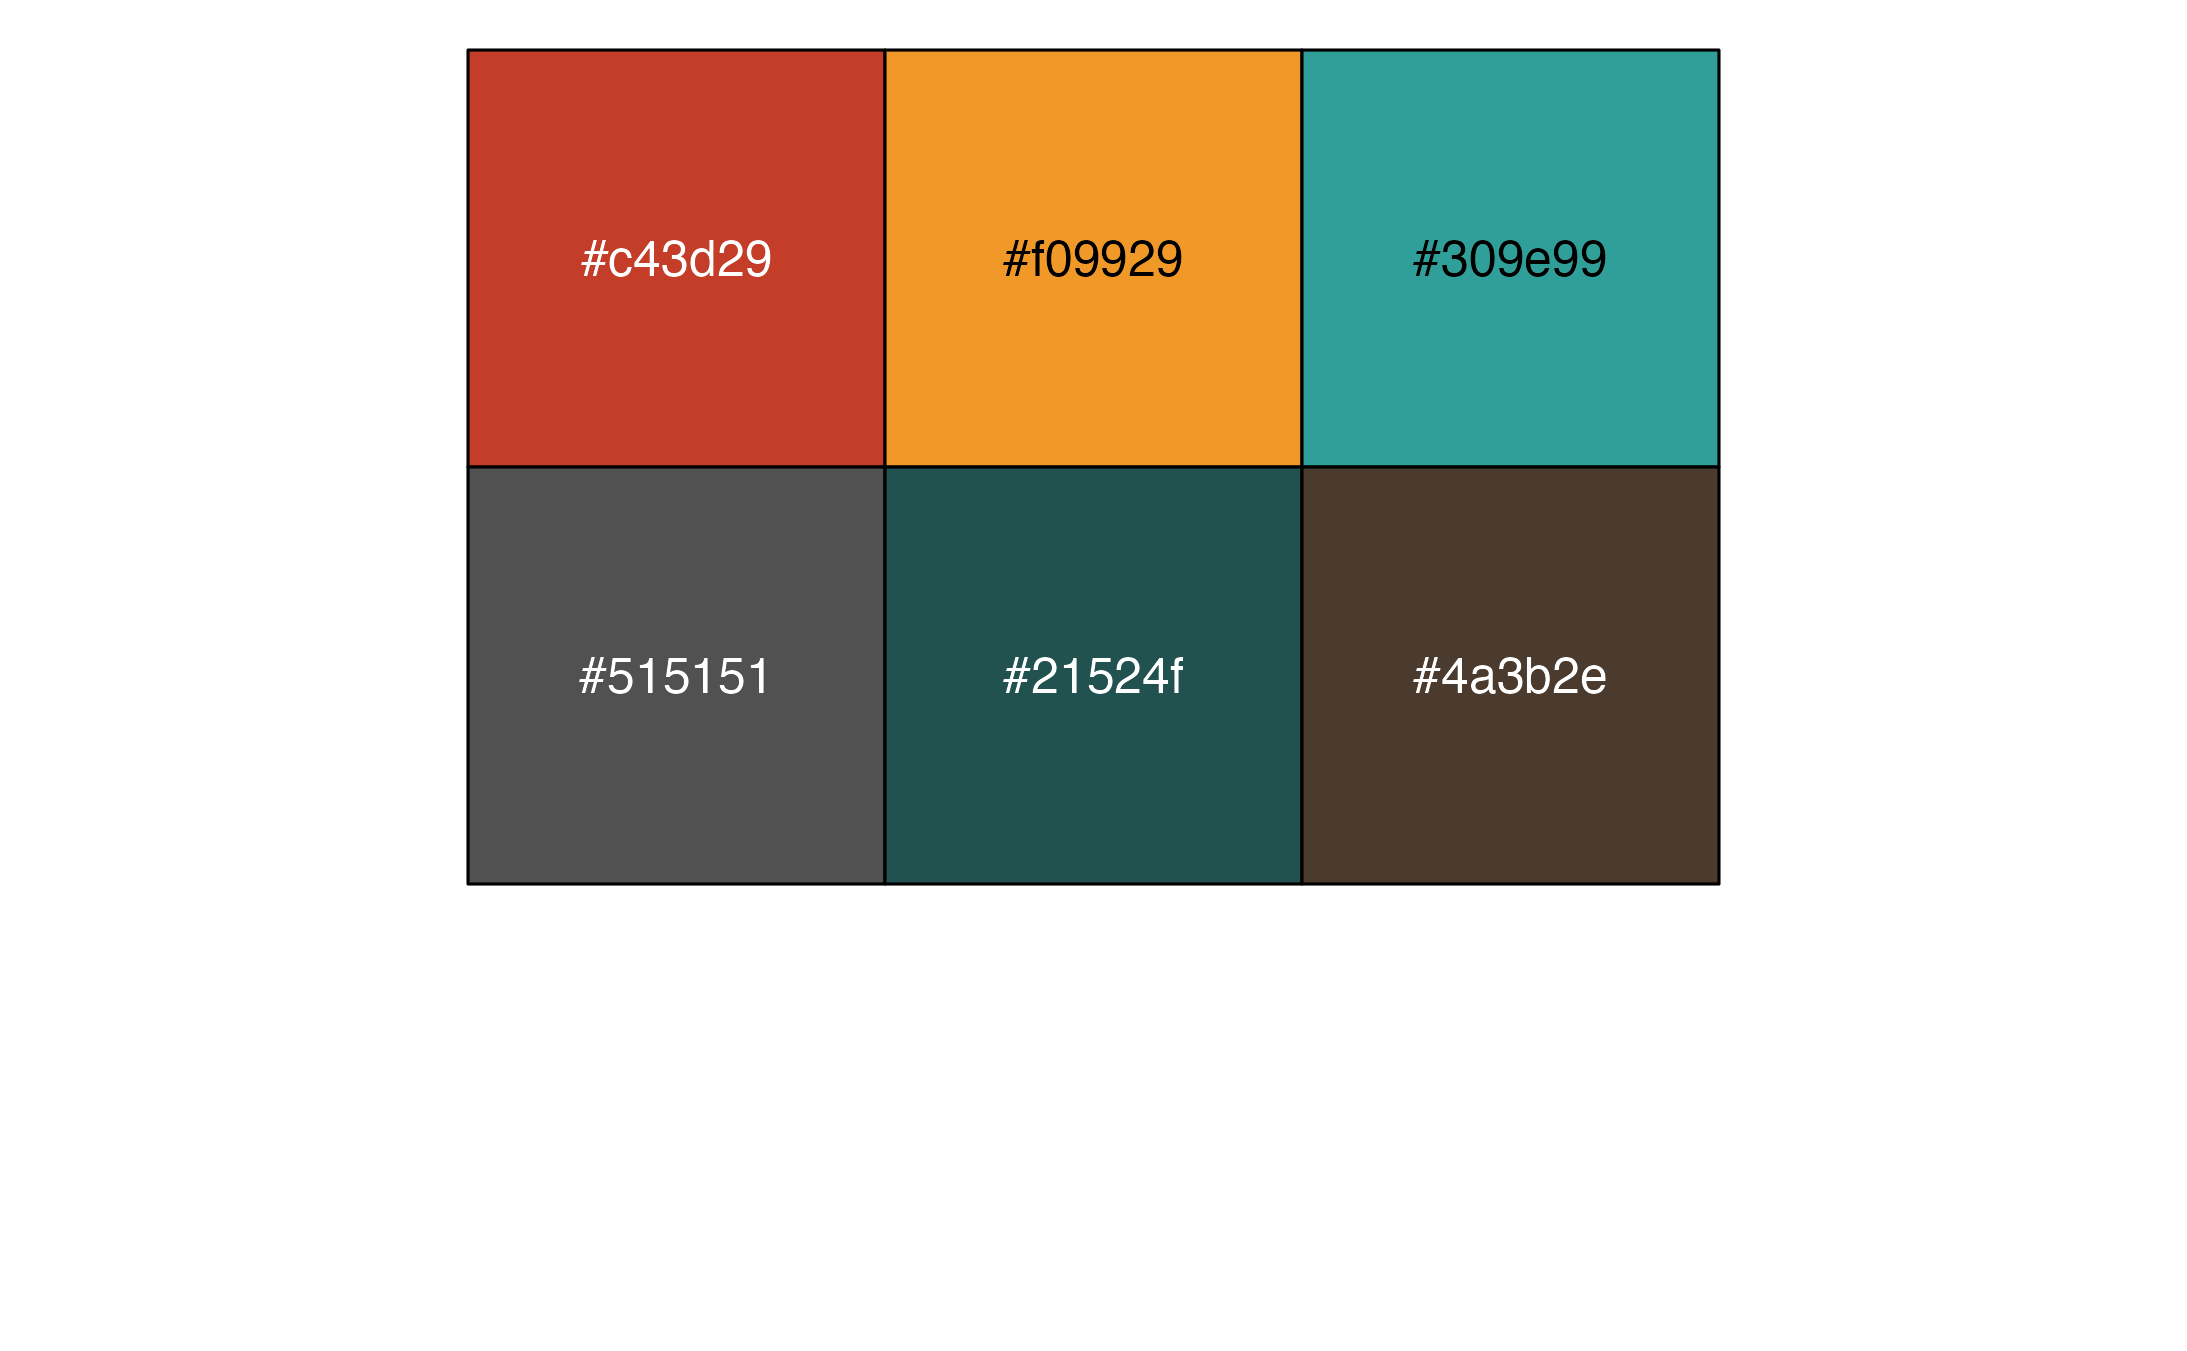
There are also additional palettes.
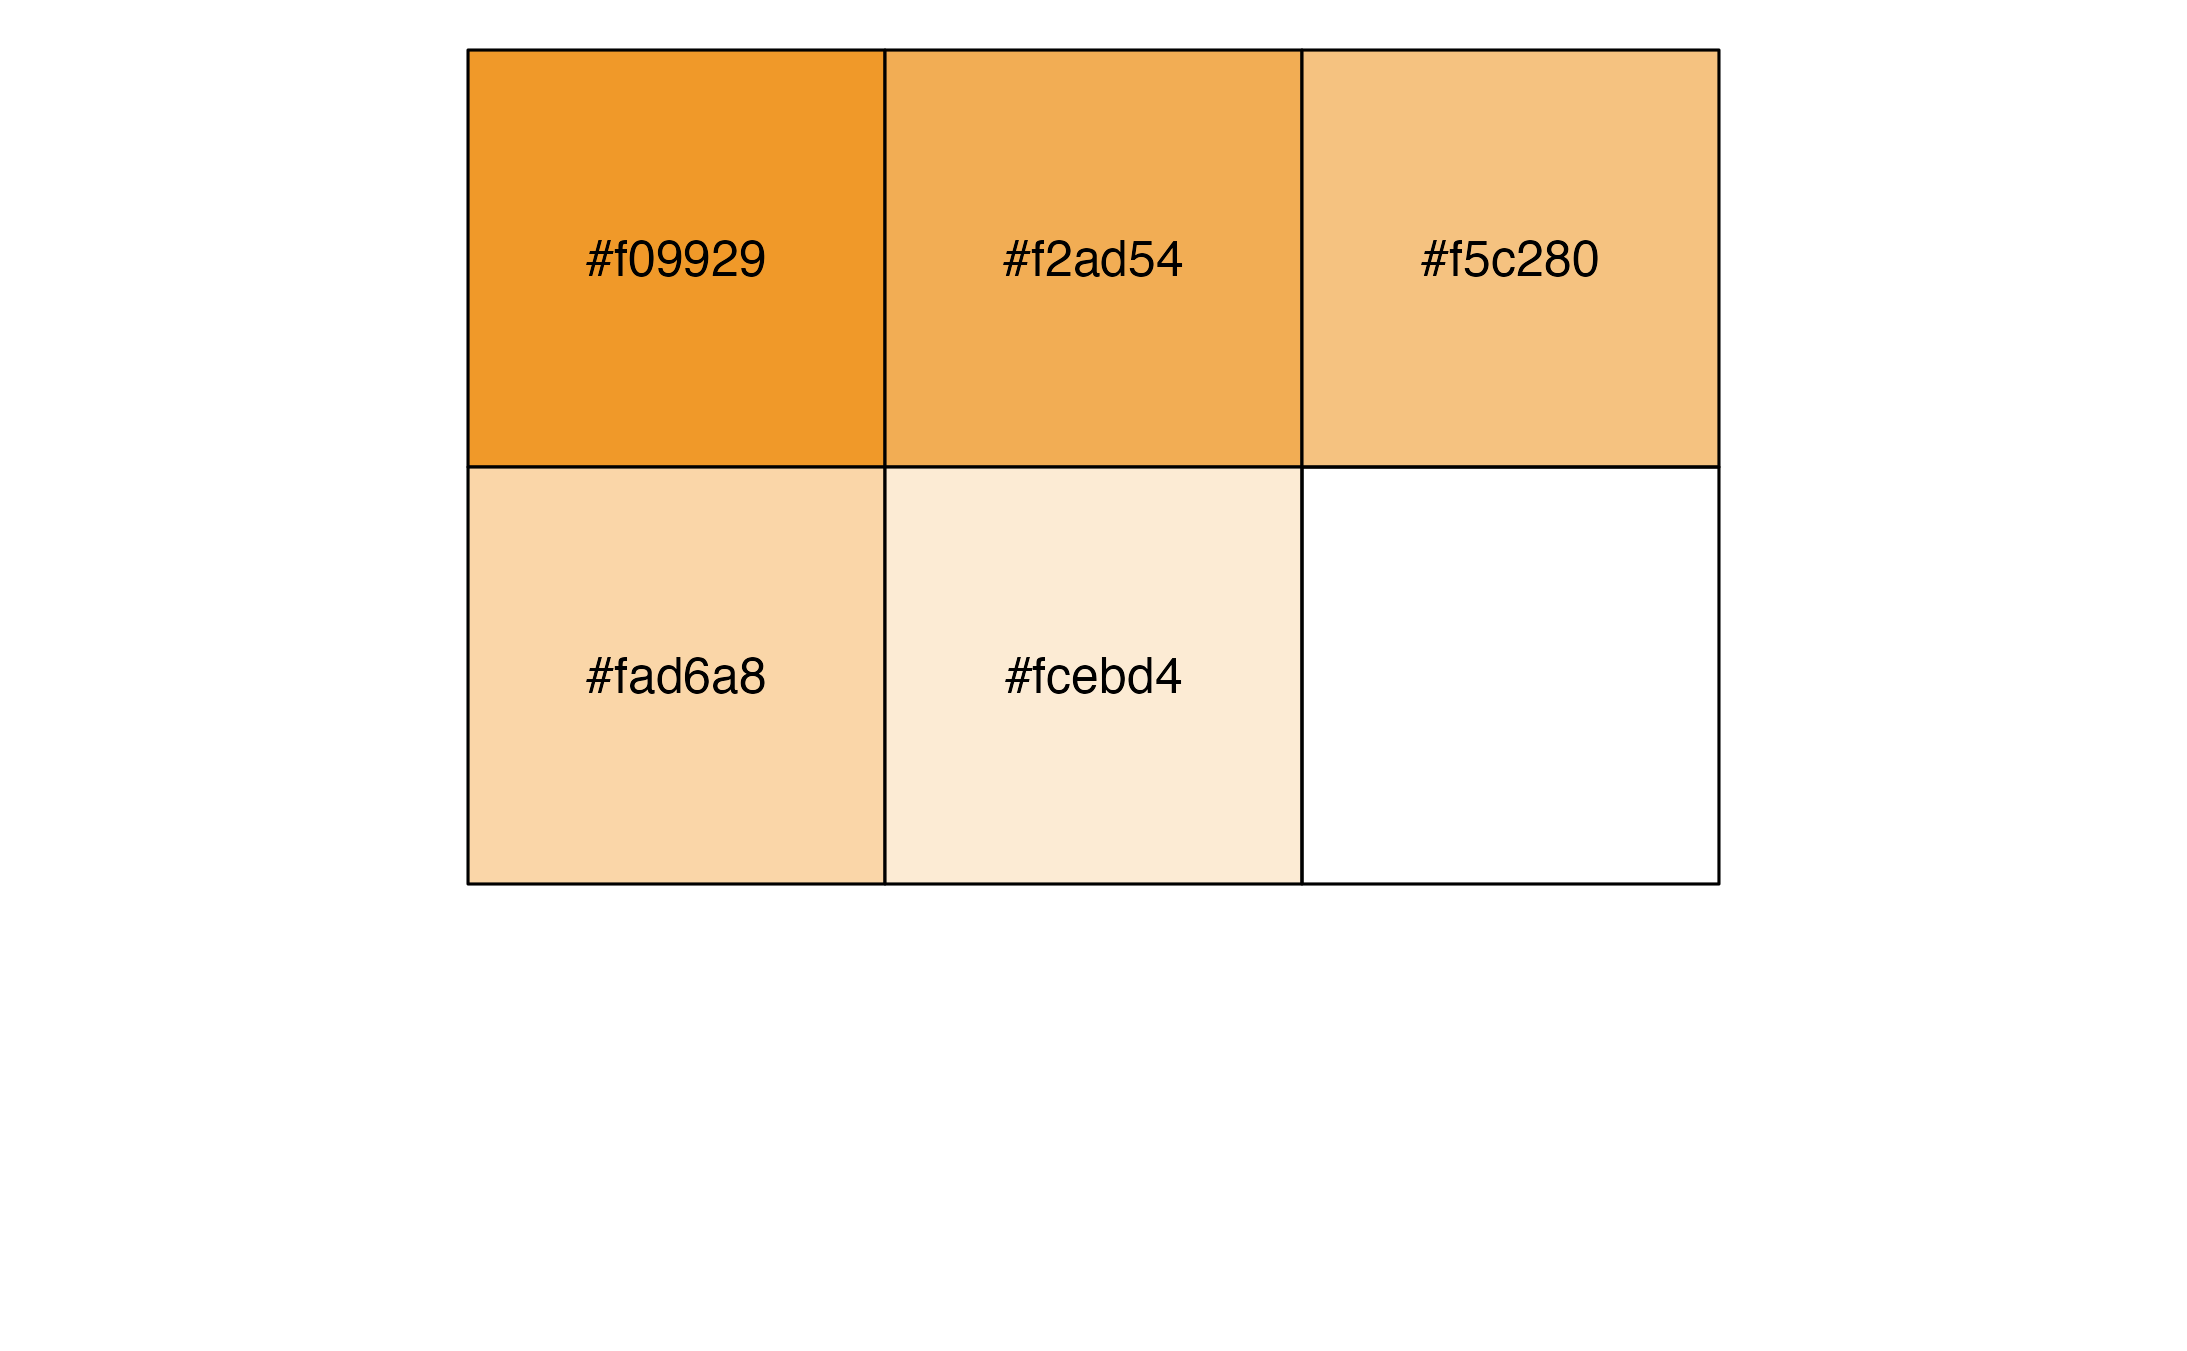
Yellows
Reds

Greens
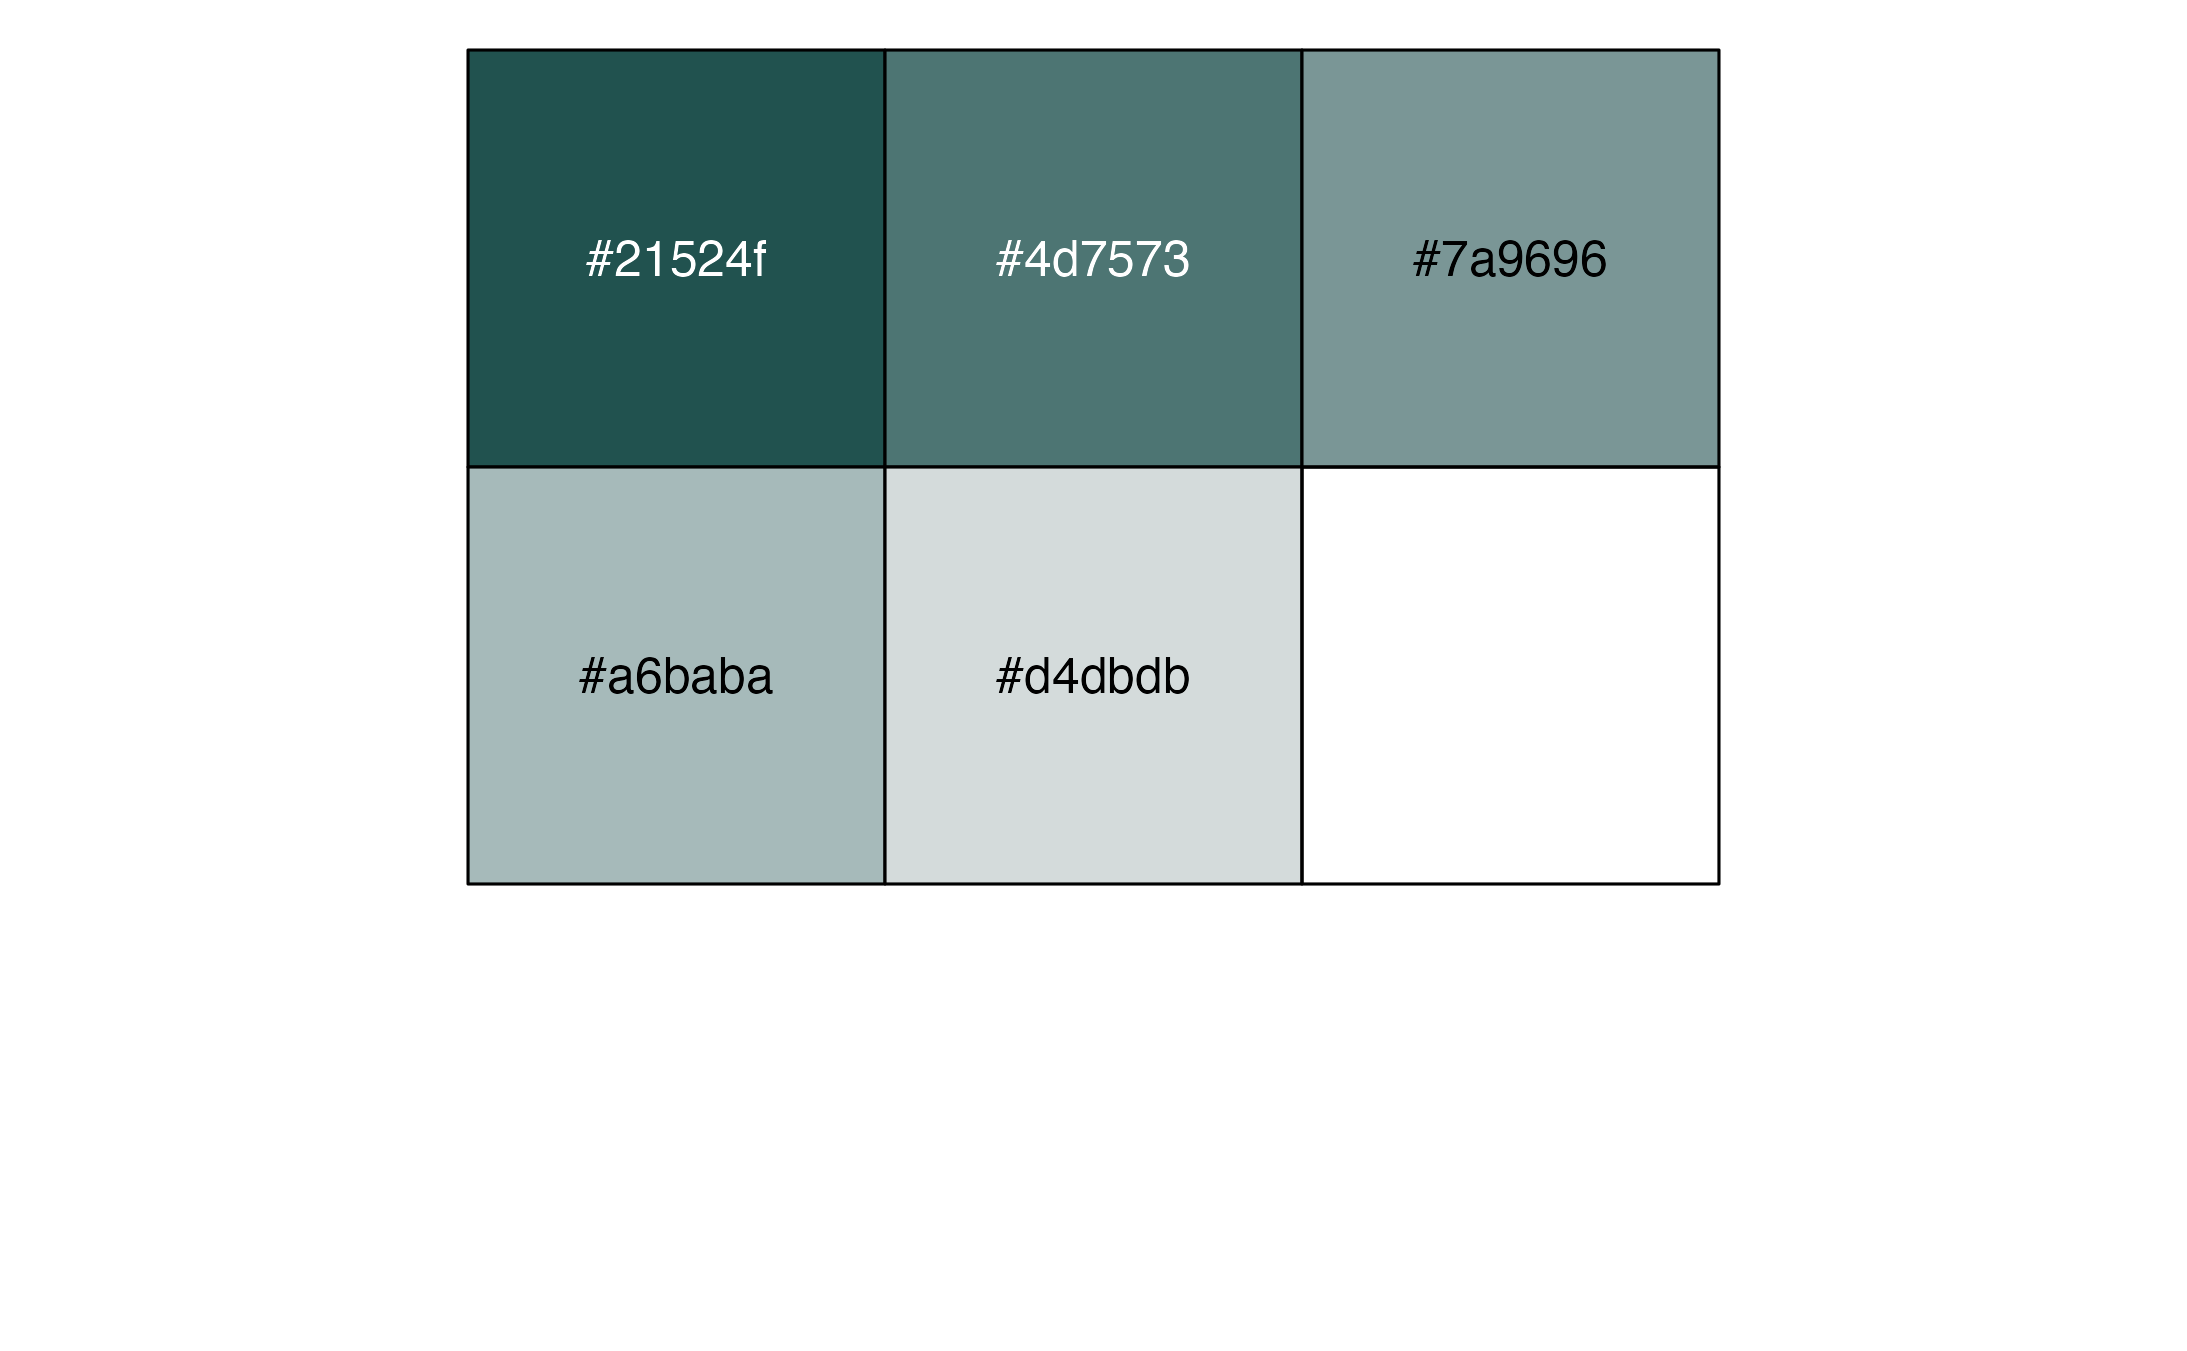
Teals

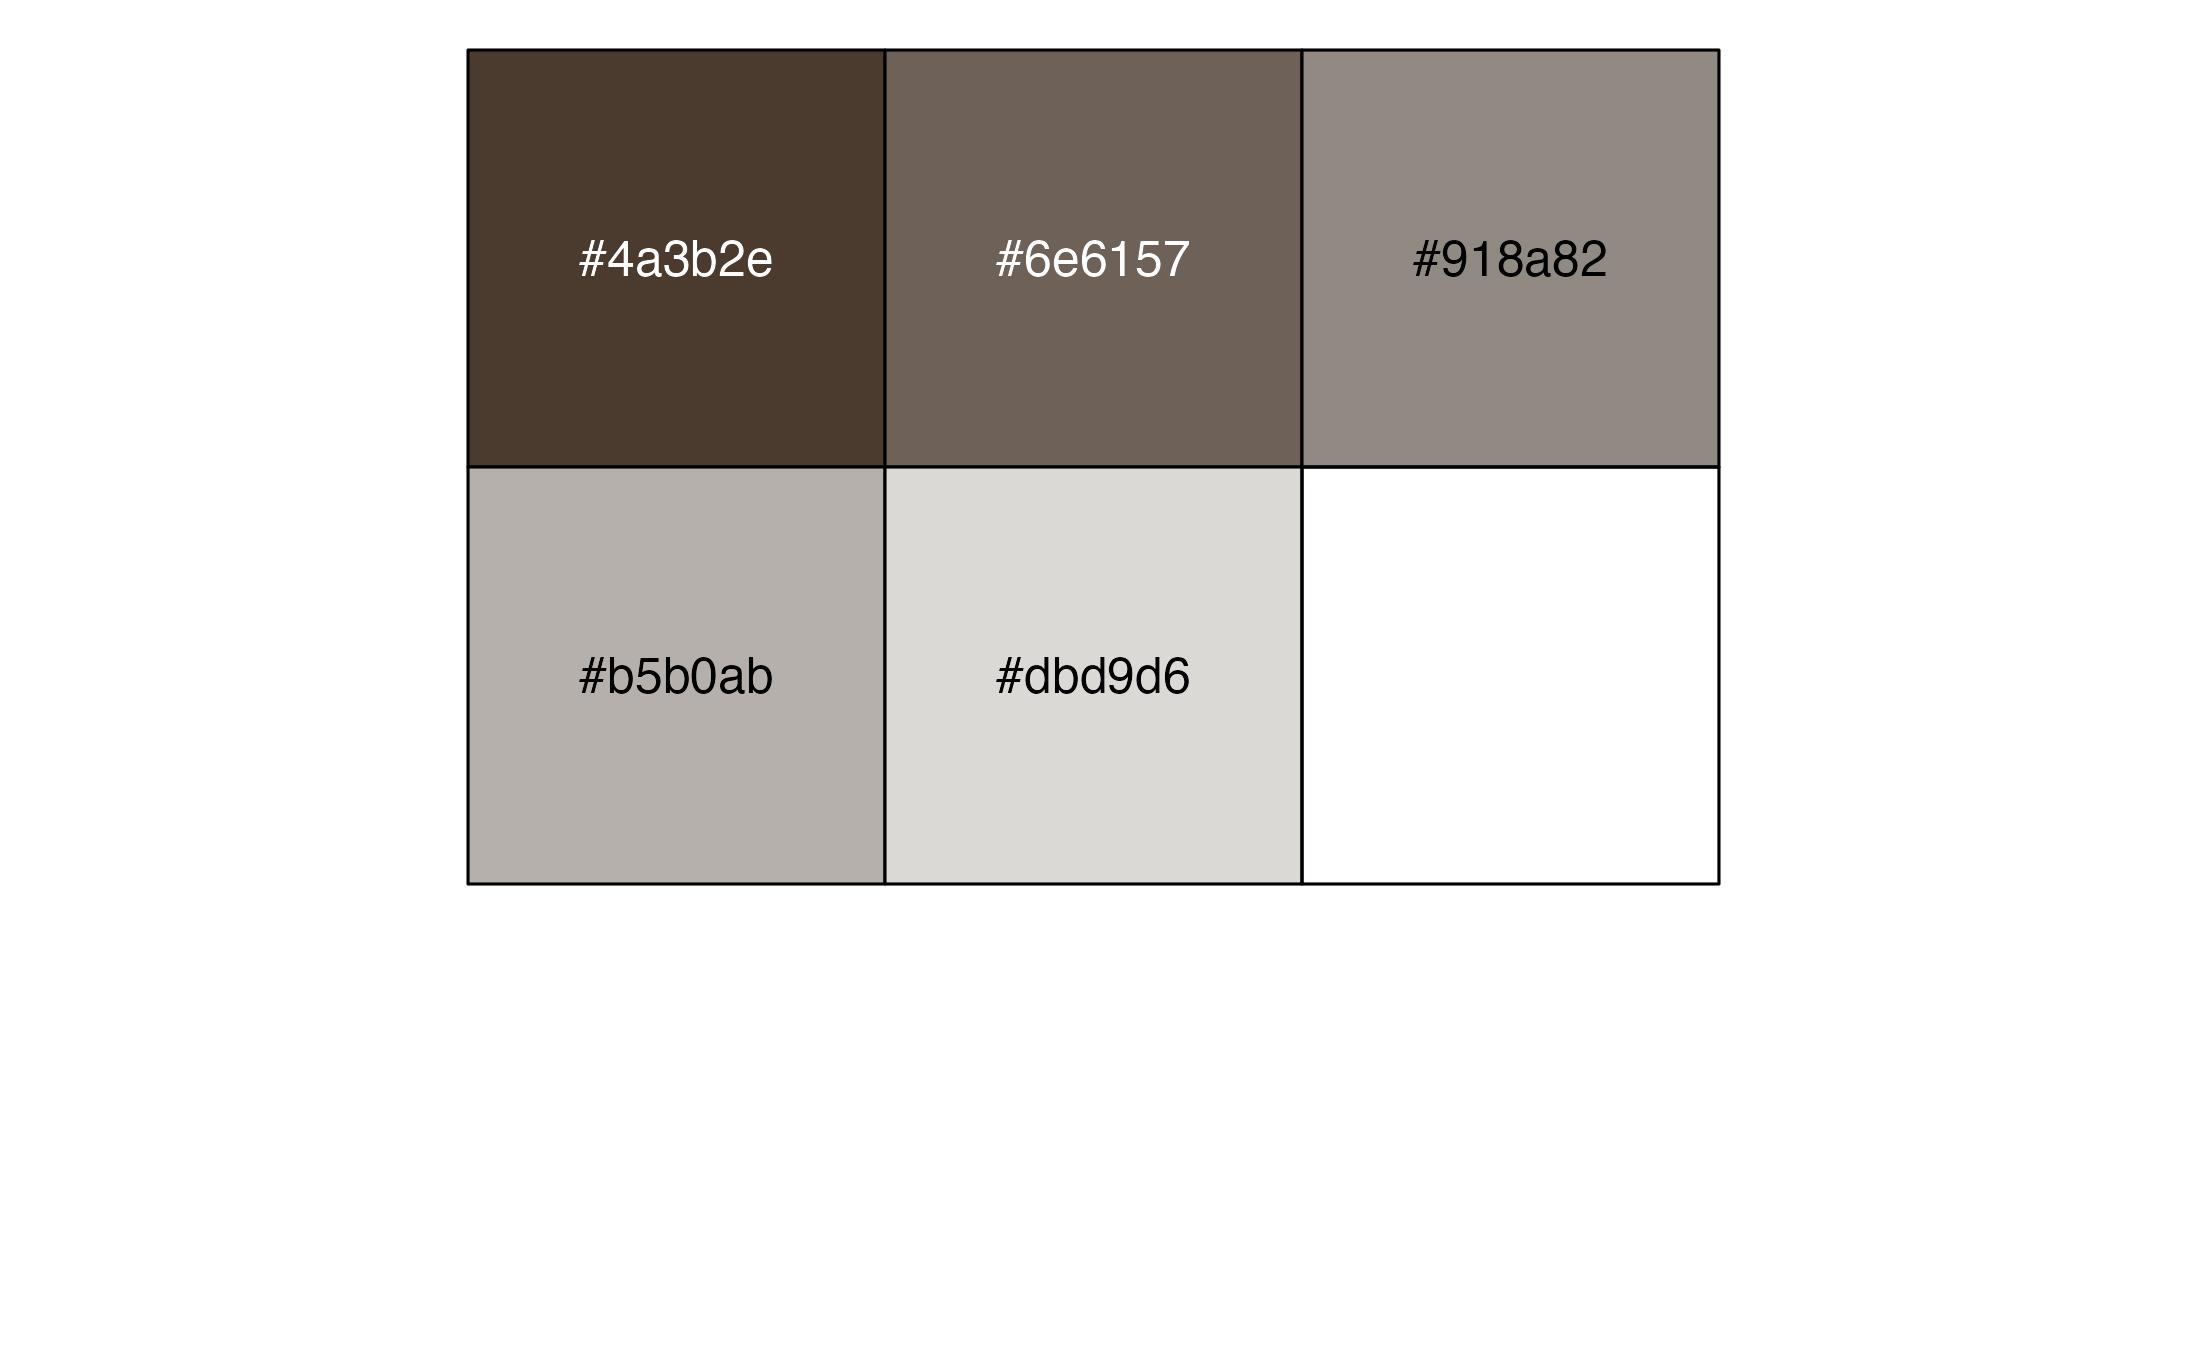
Browns
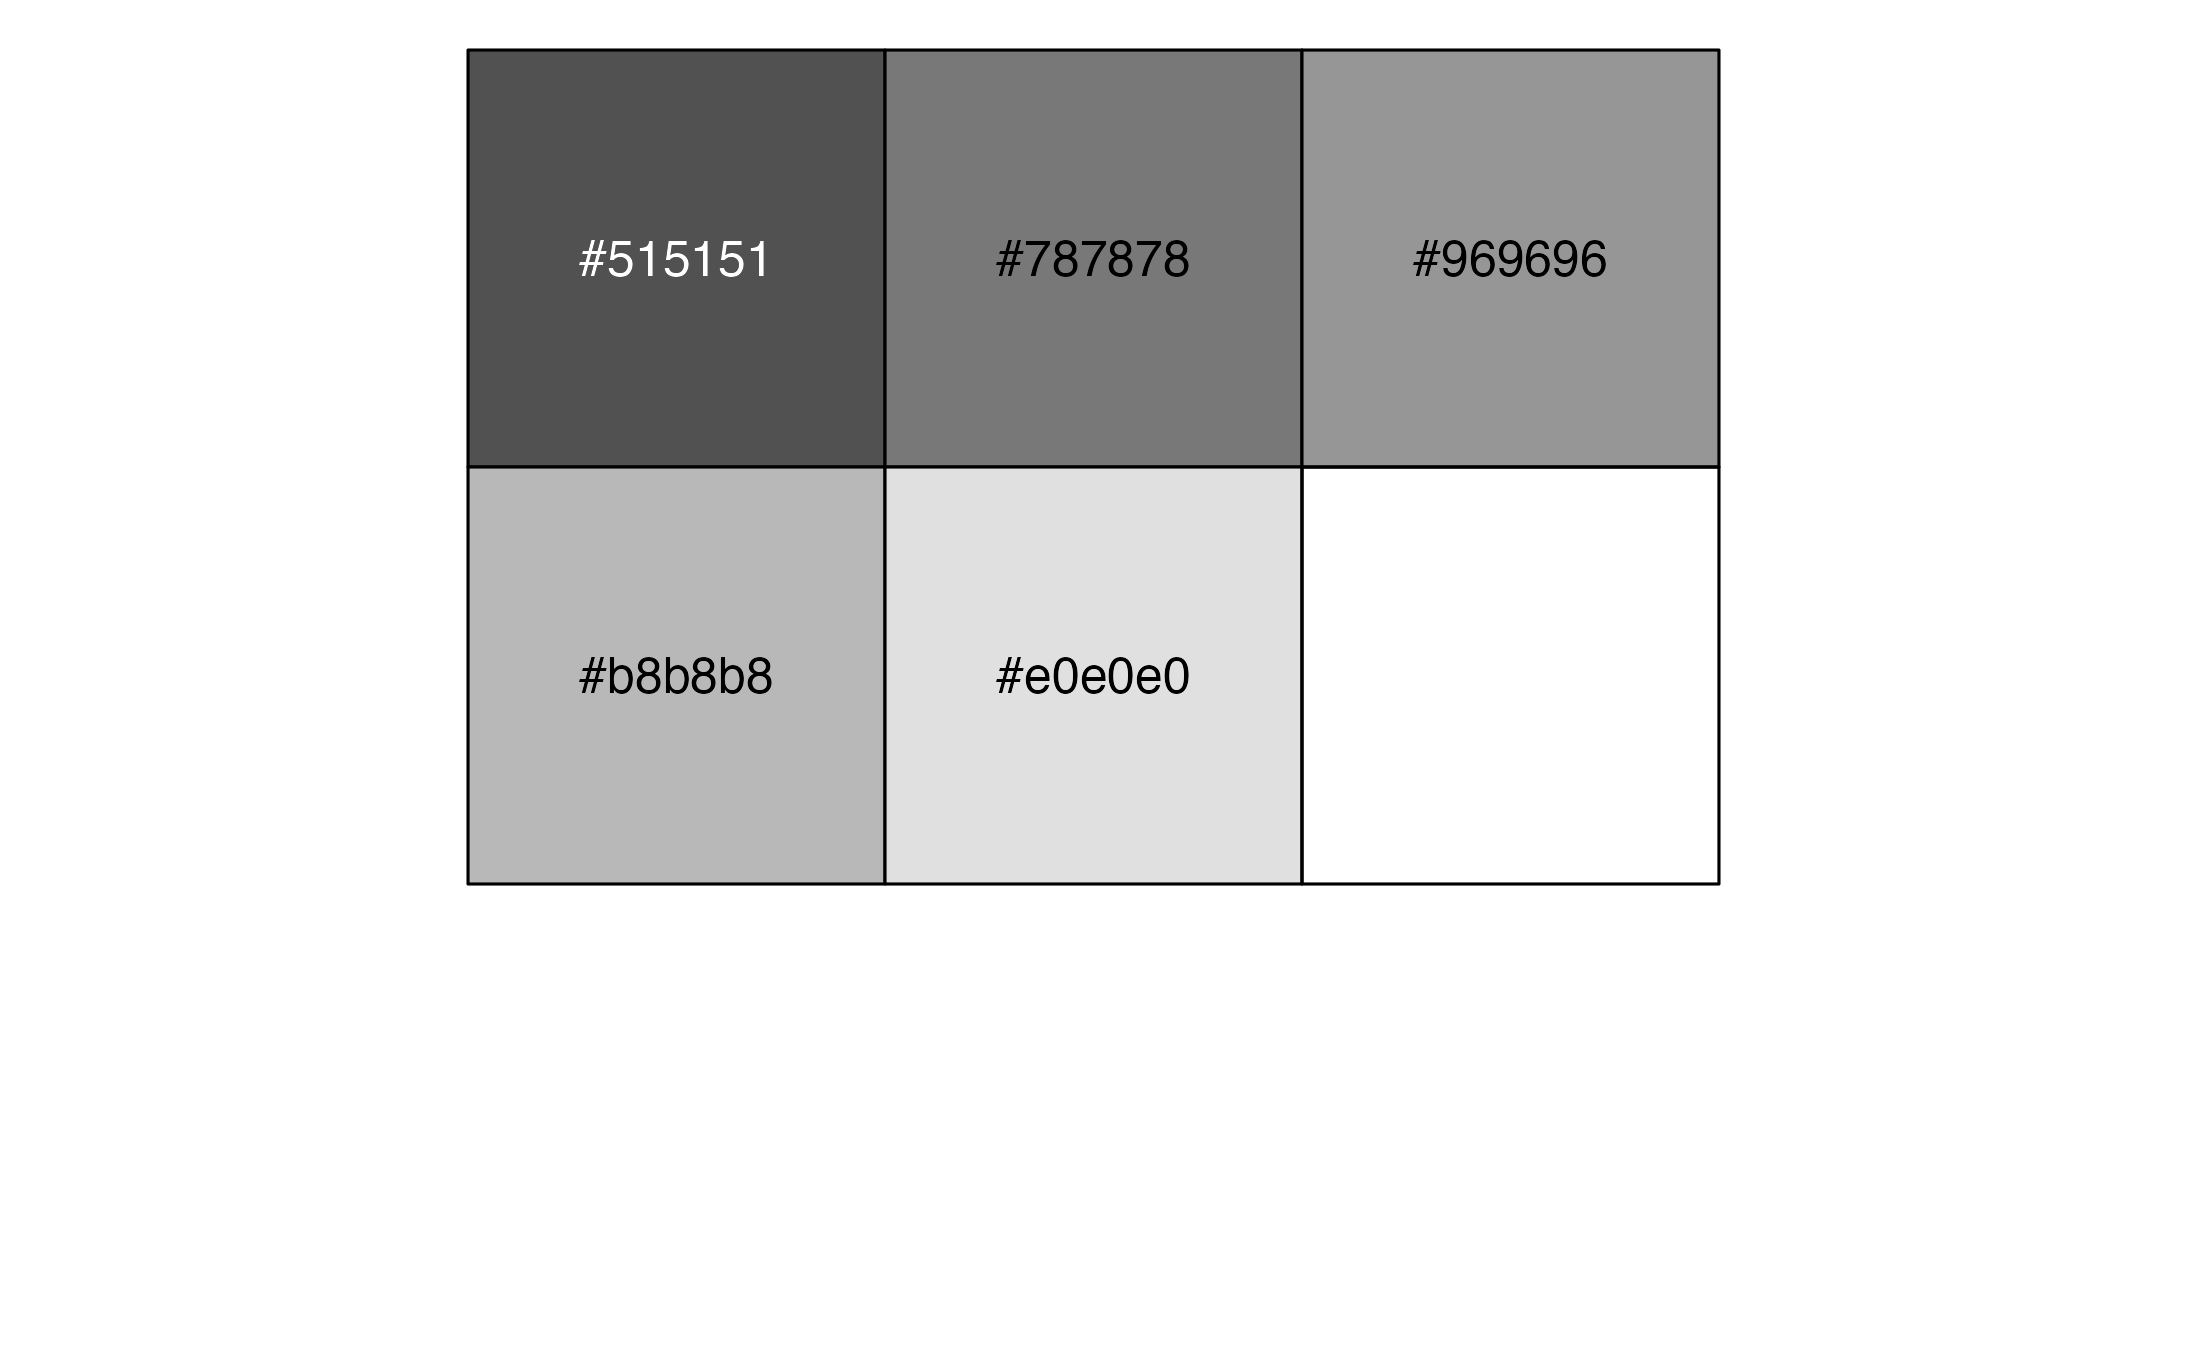
Greys
Color and fill scales
Discrete scales
You can use the scale_fill_cardea_discrete() function to
change the fill on a plot.
penguins %>%
  group_by(island) %>%
  summarize(avg_bill_length = mean(bill_length_mm, na.rm = TRUE)) %>%
  ggplot(aes(x = island, y = avg_bill_length,
             fill = island)) +
  geom_col() +
  scale_fill_cardea_discrete()
The scale_fill_cardea_discrete() uses the Multicolor
palette by default but you can use any of the above palettes.
penguins %>%
  group_by(island) %>%
  summarize(avg_bill_length = mean(bill_length_mm, na.rm = TRUE)) %>%
  ggplot(aes(x = island, y = avg_bill_length,
             fill = island)) +
  geom_col() +
  scale_fill_cardea_discrete(palette = "Teals")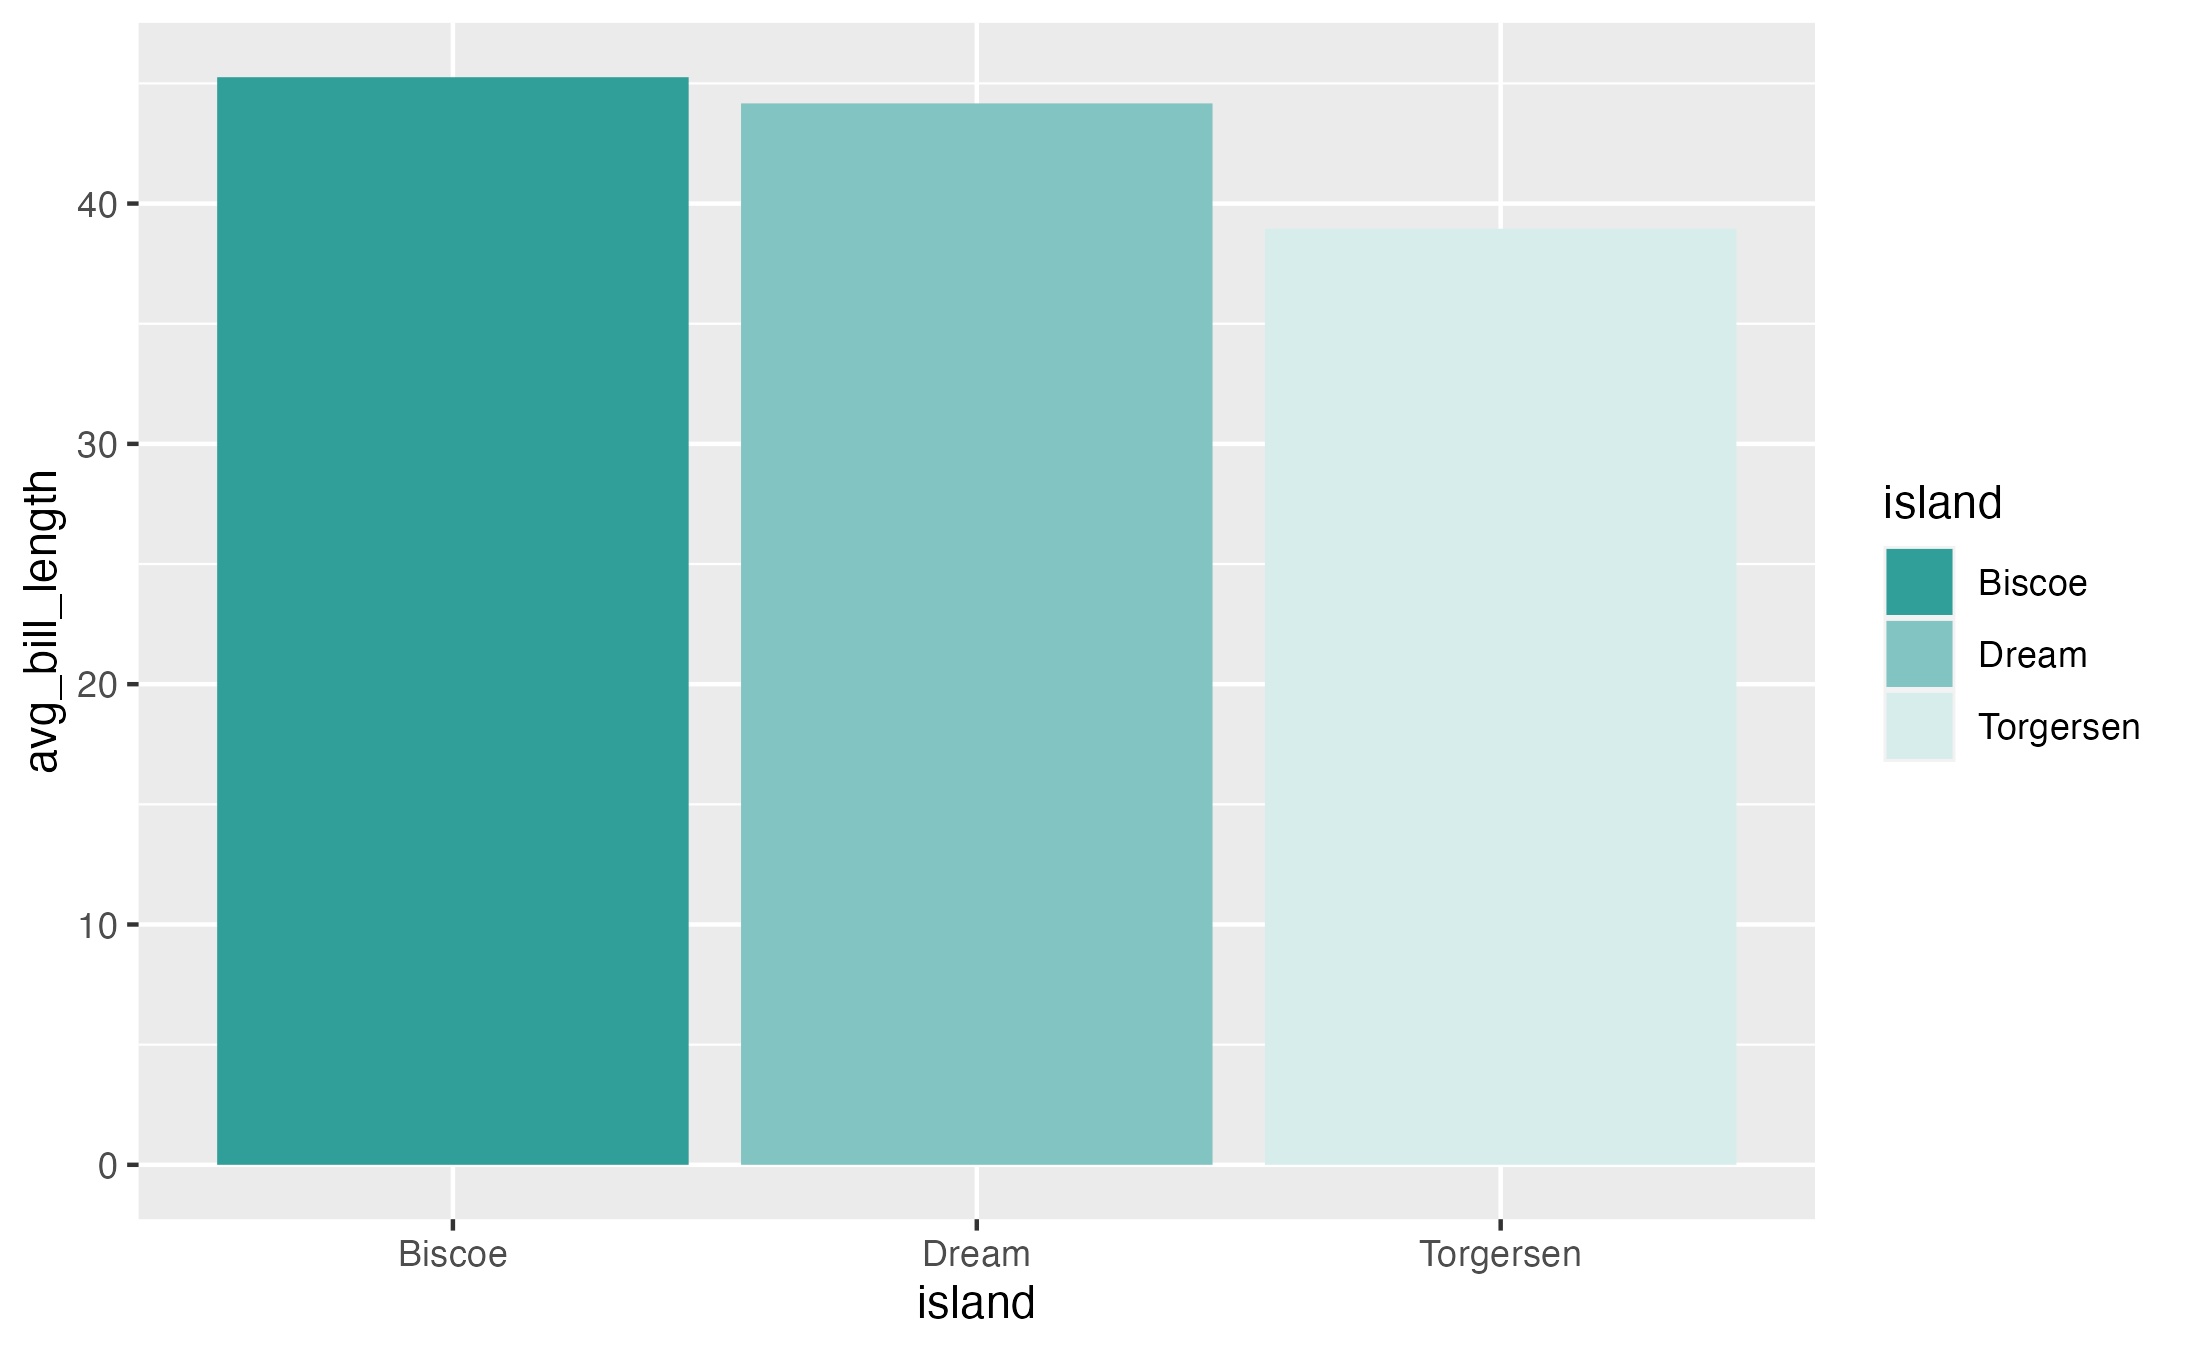
You can also reverse the order by using the reverse argument.
penguins %>%
  group_by(island) %>%
  summarize(avg_bill_length = mean(bill_length_mm, na.rm = TRUE)) %>%
  ggplot(aes(x = island, y = avg_bill_length,
             fill = island)) +
  geom_col() +
  scale_fill_cardea_discrete(reverse = TRUE)
Need more control? There is a cardea_colors() function
that you can use with scale_fill_manual() to select
individual colors. You can choose from:
- Yellow, Light Yellow, Light Yellow #1, Light Yellow #2, Light Yellow #3
- Red, Light Red, Light Red #1, Light Red #2, Light Red #3
- Green, Light Green, Light Green #1, Light Green #2, Light Green #3
- Teal, Light Teal, Light Teal #1, Light Teal #2, Light Teal #3
- Brown, Light Brown, Light Brown #1, Light Brown #2, Light Brown #3
- Grey, Light Grey, Light Grey #1, Light Grey #2, Light Grey #3
penguins %>%
  group_by(island) %>%
  summarize(avg_bill_length = mean(bill_length_mm, na.rm = TRUE)) %>%
  ggplot(aes(x = island, y = avg_bill_length,
             fill = island)) +
  geom_col() +
  scale_fill_manual(values = cardea_colors("Yellow", "Red", "Teal"))
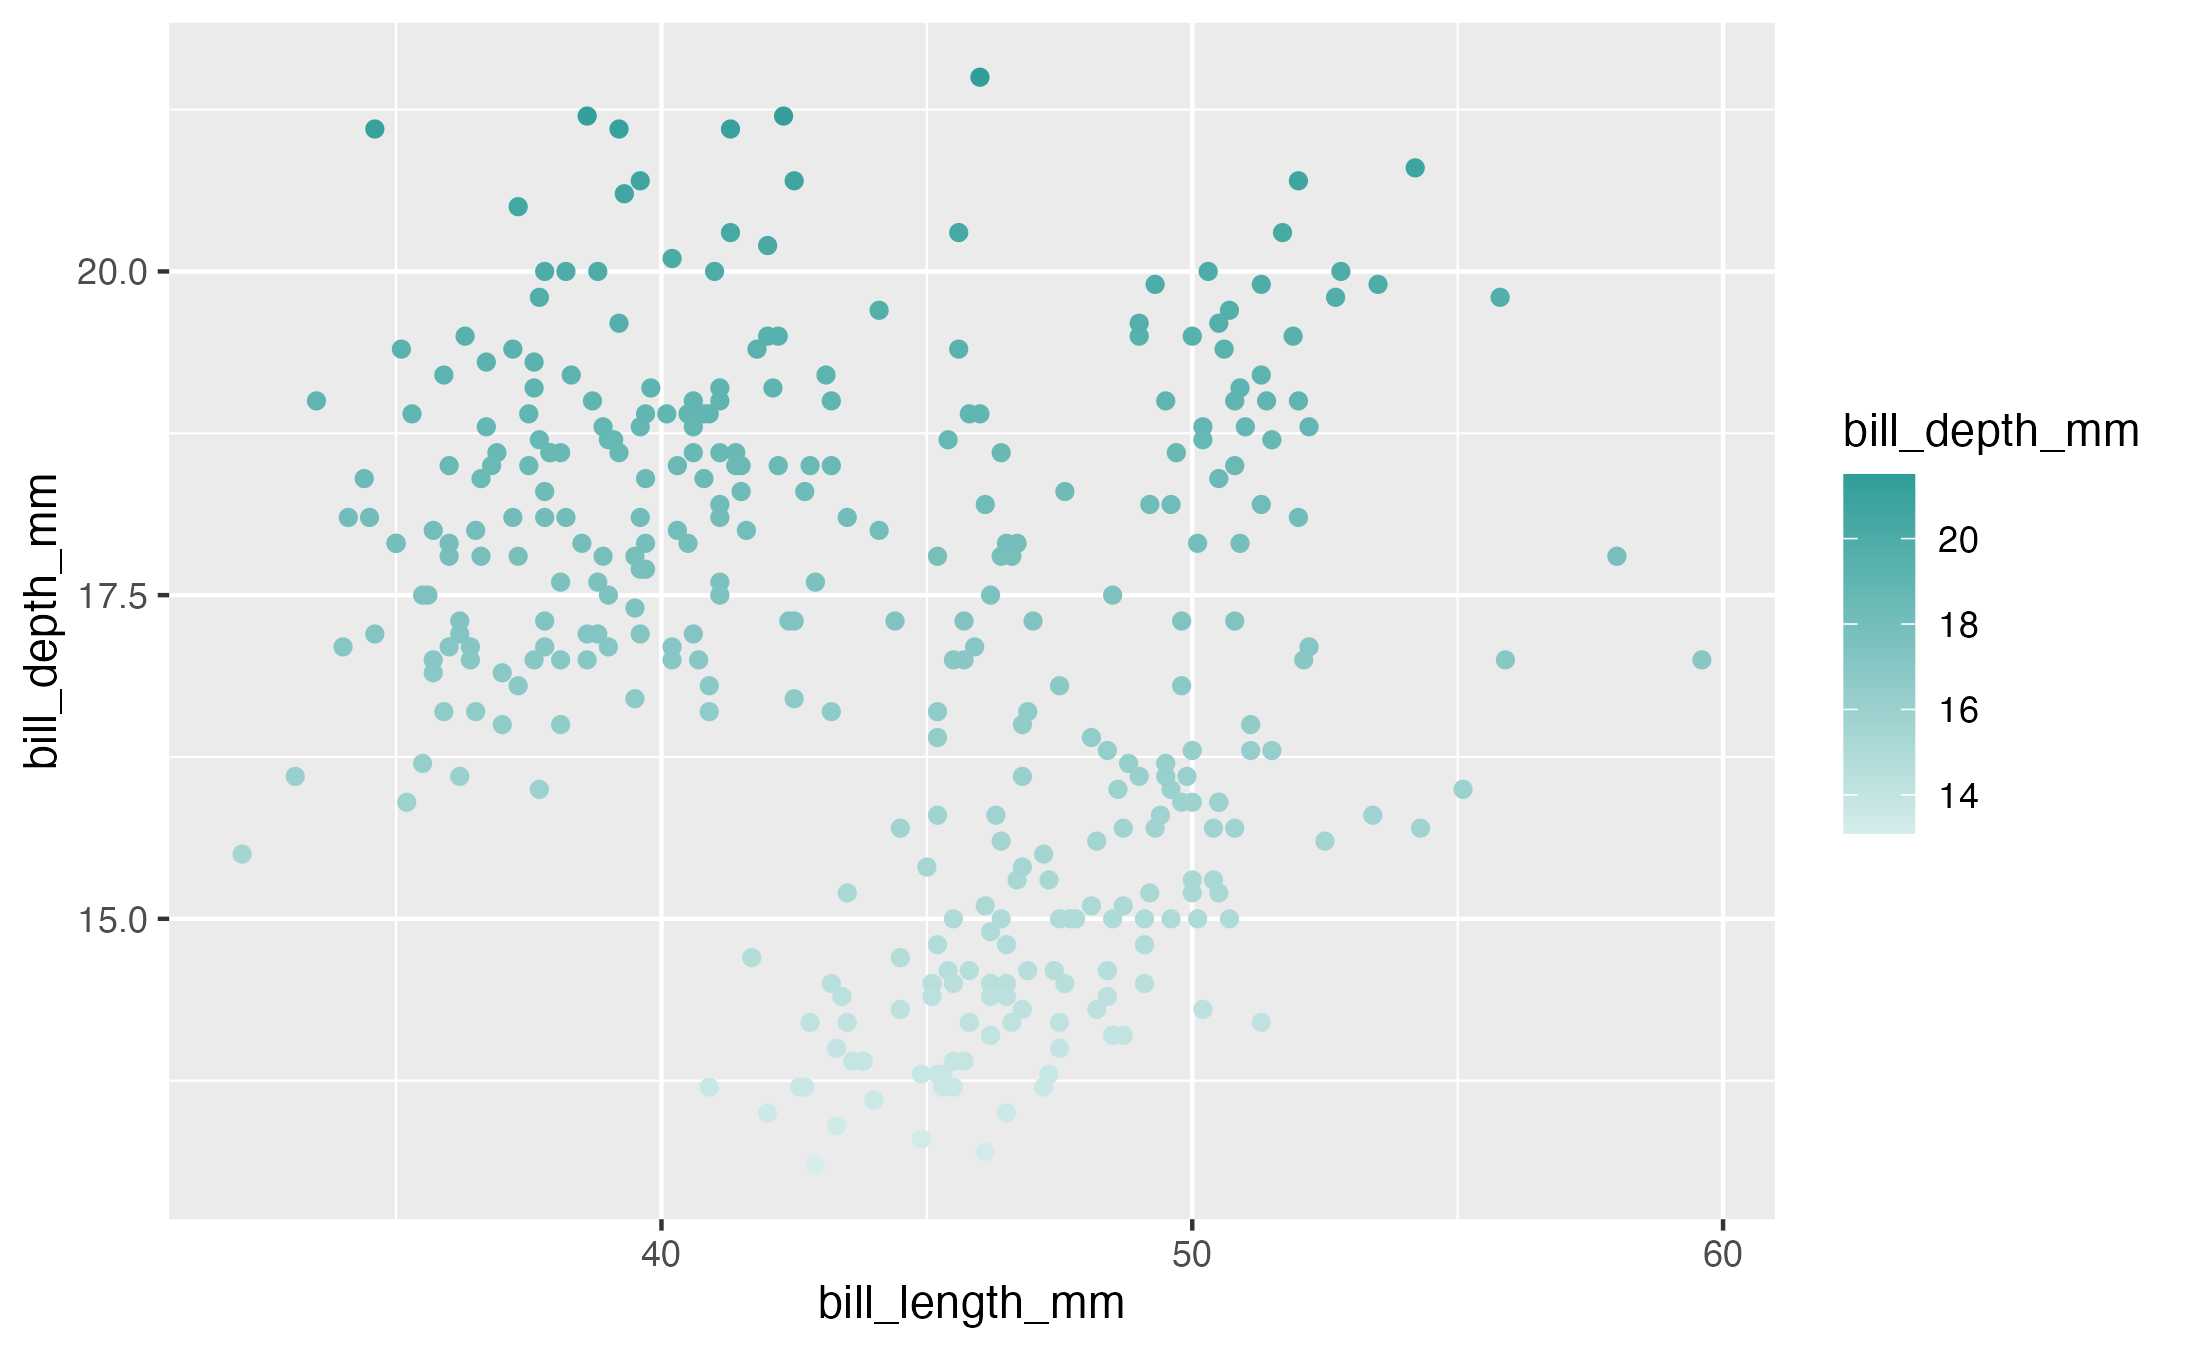
Continuous scales
You can also use the scale_color_cardea_continuous() and
scale_fill_cardea_continuous() functions for numeric
variables.
penguins %>%
  ggplot(aes(x = bill_length_mm, y = bill_depth_mm,
             color = bill_depth_mm)) +
  geom_point() +
  scale_color_cardea_continuous(palette = "Teals")